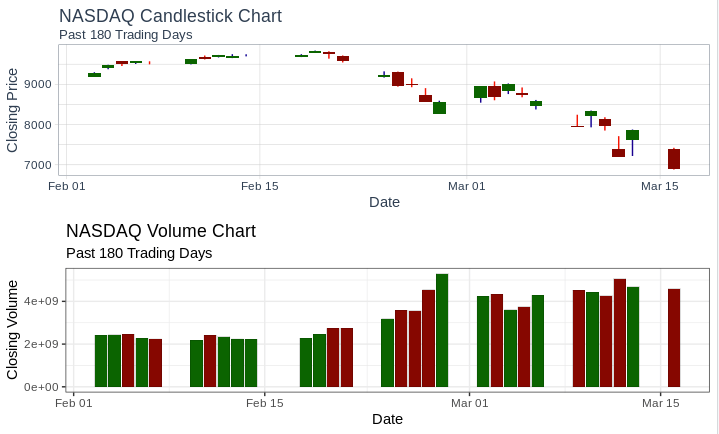
To spot a “bear trap”, or as I call it a “dead cat bounce”, is easy to do once you become tuned to price volume action. A wise man once told me, “volume never lies”. Below are the price and volume charts for the NASDAQ from February 3 to March 16. From February 3 to February 18 the Closing Price (index value) for the NASDAQ increases, but the corresponding volume declines slowly. Starting on the 19th, the NASDAQ experienced a series of down days with increasing volume, with the biggest volume spike occurring on the 27th. The following Monday the price on the NASDAQ sharply increased, but the volume was low! The trap is set (or the cat is dropped). On March 3rd and 4th the NASADQ price remained relatively flat, increasing slightly on the 4th. Then on March 5th the trap is sprung (the cat didn’t bounce because… it’s dead) and the NASDAQ continues to decline with increasing volume. And that is how you spot a dead cat bounce. Look for an increase in price after a period decline with greater and increasing volume. If you see this pattern you should consider selling.
Bear Traps and Dead Cats
Published

You must be logged in to post a comment.